Height
Heights can be loaded into a map based on data sources as well. Previously (until January 2017) there were two static datasets: SRTM3 and SRTM1. Currently there are two dynamic datasets provided by Mapbox and Mapzen. The new elevation data has zoomlevels which means you can get terrain heights for any map size: from city to continent.
You can add terrain heights to a satellite map by picking one of the two items from the Terrain heights dropdown. Pick a zoomlevel or use the Estimate zoomlevel button. Make sure you have a valid API key entered for Mapbox or Mapzen. Read more about API keys here: Map API key
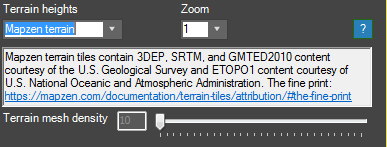
The terrain height section
Using terrain heights on multiple scales
Terrain resolution
Similar to the regular image sources for satellite maps, the terrain resolution can be altered by changing the zoomlevel. You can specify the zoomlevel of the terrain heights separately from the map images. It also means you can overdo it by picking a zoom level which is too high, meaning long waits and long processing times. The terrain heights are packed into a 16 bit displacement map, they can get heavy!
The huge advantage of the new terrain heights over the SRTM datasets is that they can be zoomed. This means you can make a map with terrain heights at large or small scales: continents and cities. The highest zoomlevel of both the Mapbox and Mapzen data is based on SRTM though. They go to zoomlevel 14 or 15.
Here’s a series of images of Port-au-Prince rendered at 1200px with Mapbox light map images and Mapzen terrain heights. The terrain heights have been exhaggerated in the larger scale images. You can do this yourself by changing the displacement value on the map object in the scene. The default height is 65 when working in km.
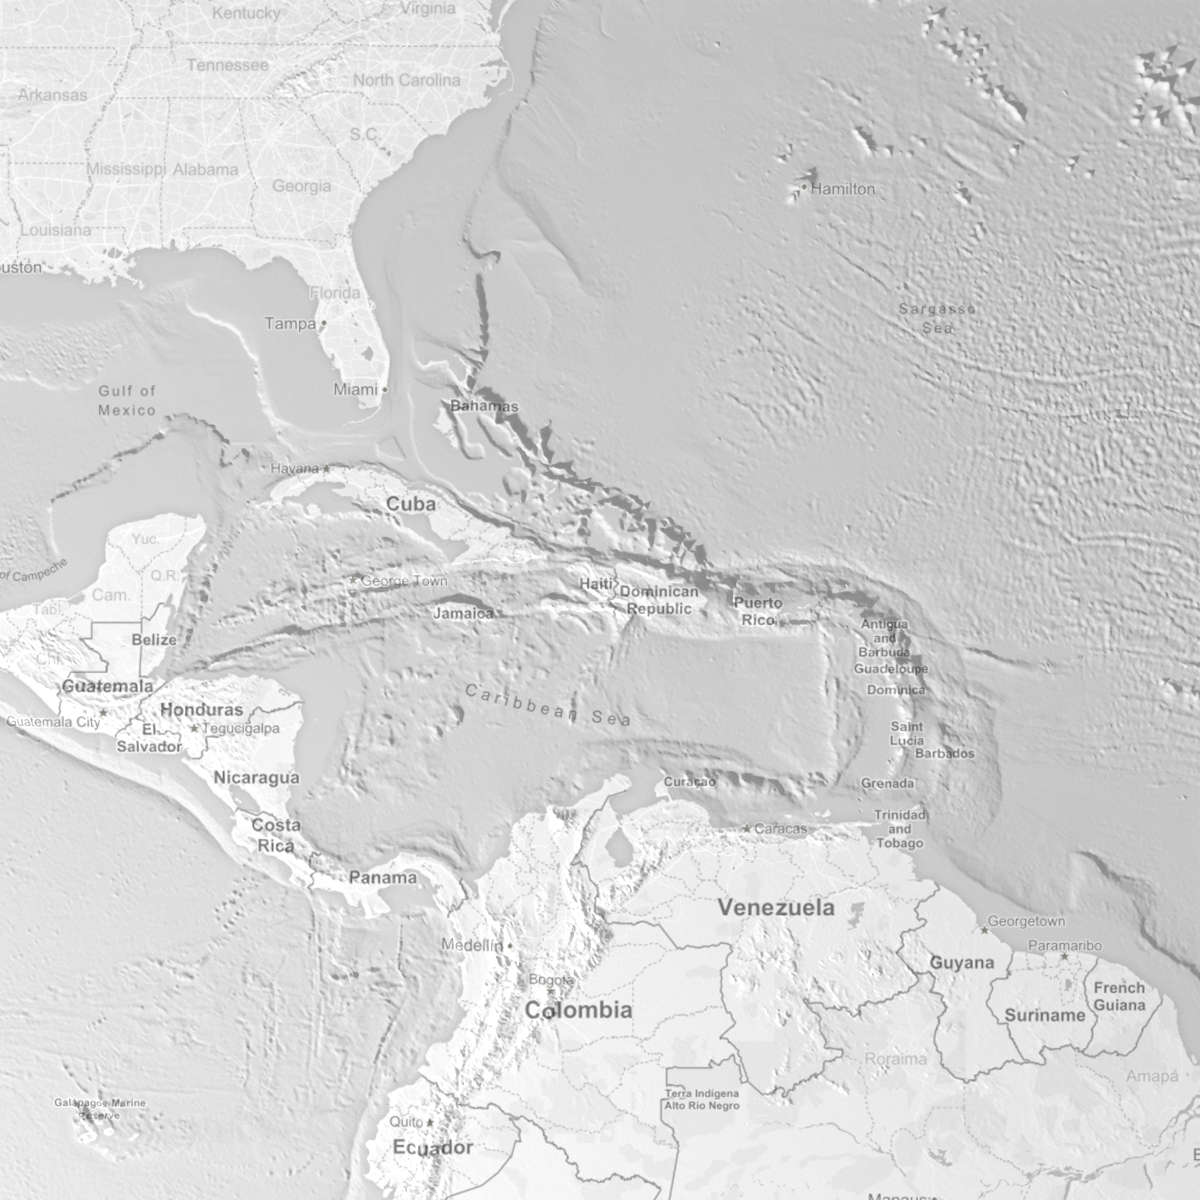
5000*5000 km, heights multiplied 6 times
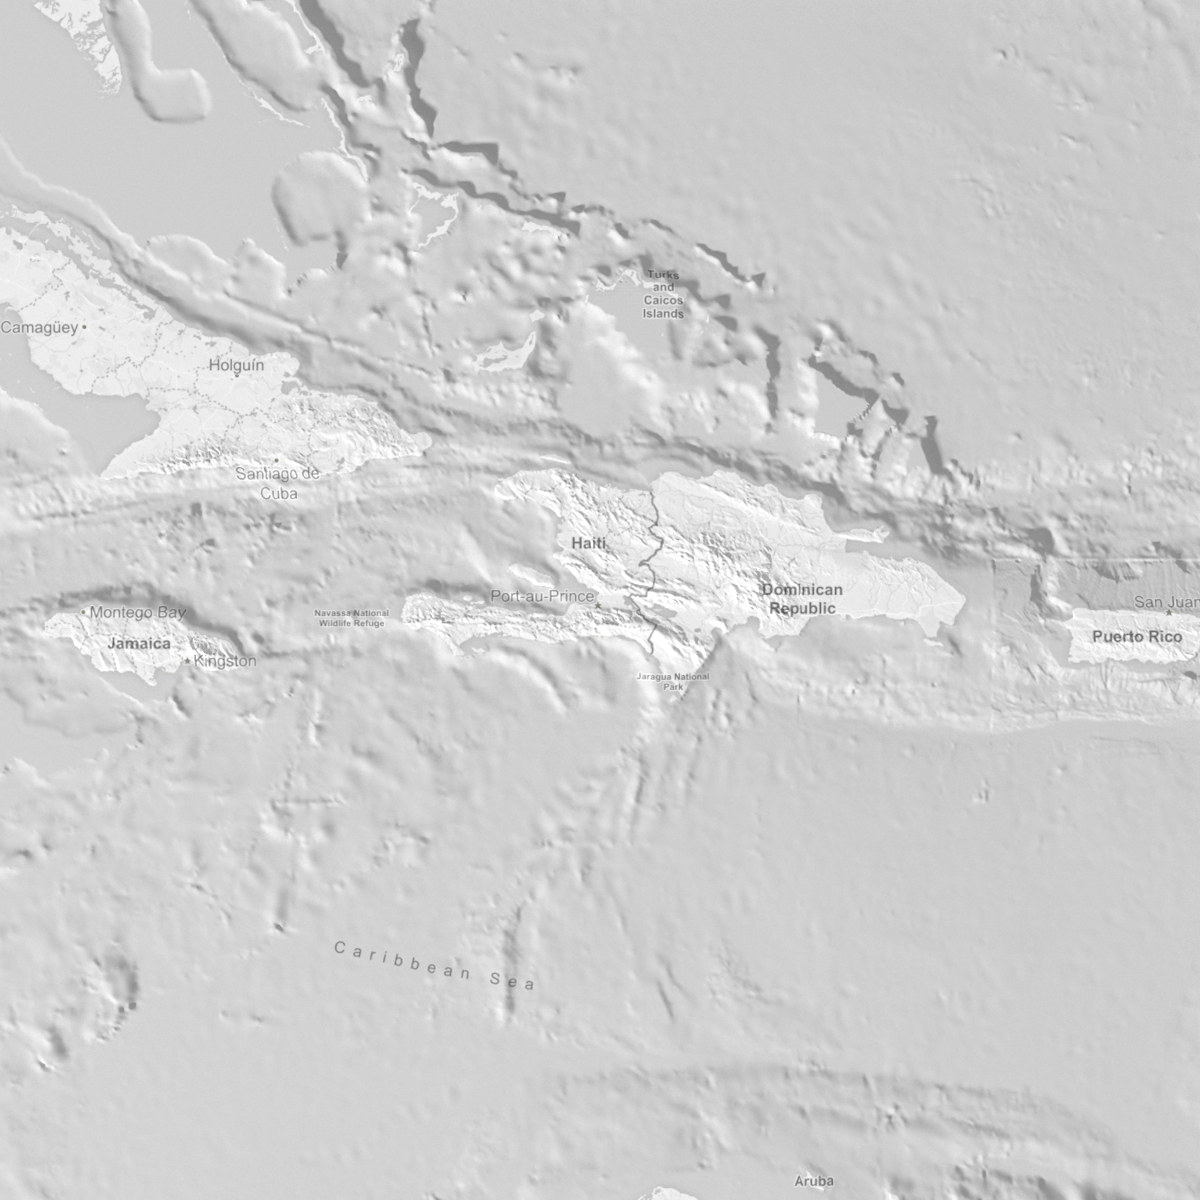
1500*1500 km, heights multiplied 3 times
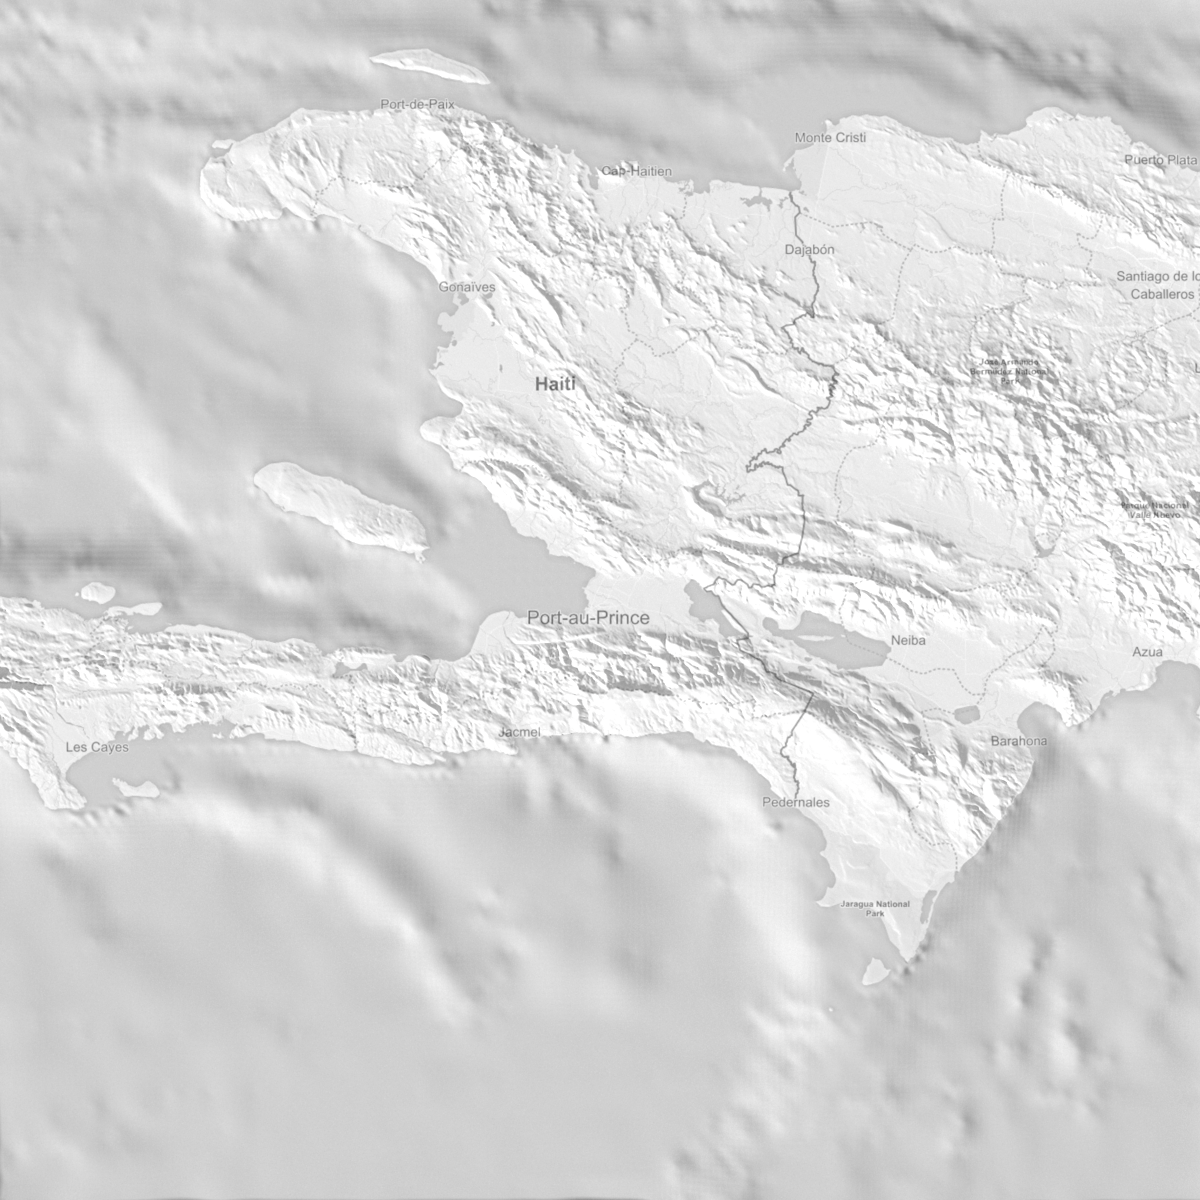
400*400 km, heights multiplied 2 times
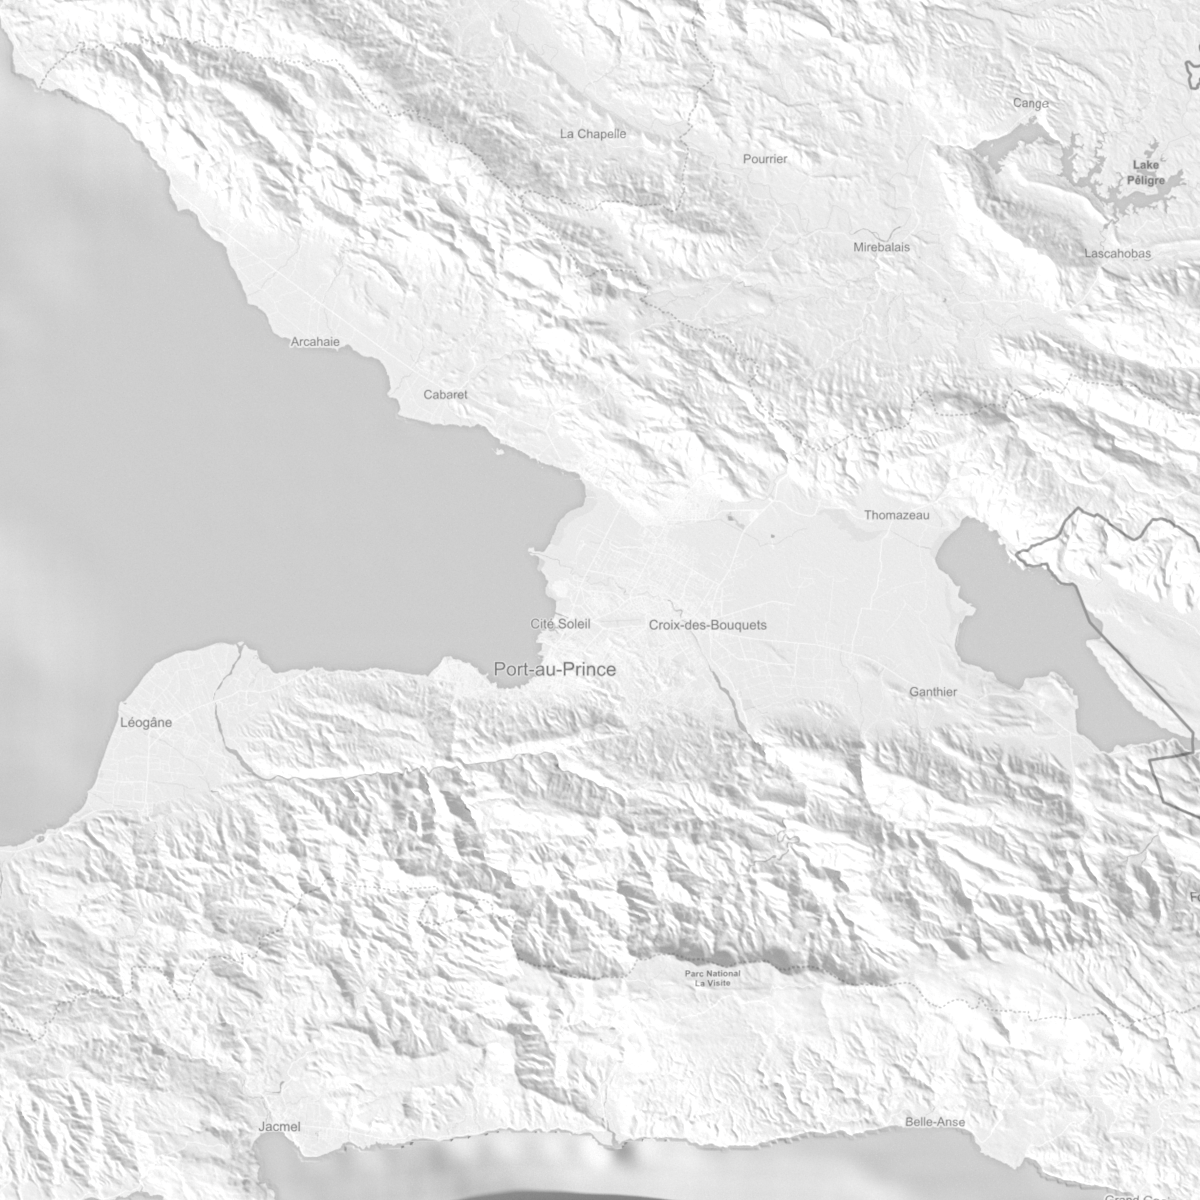
100*100 km, actual heights
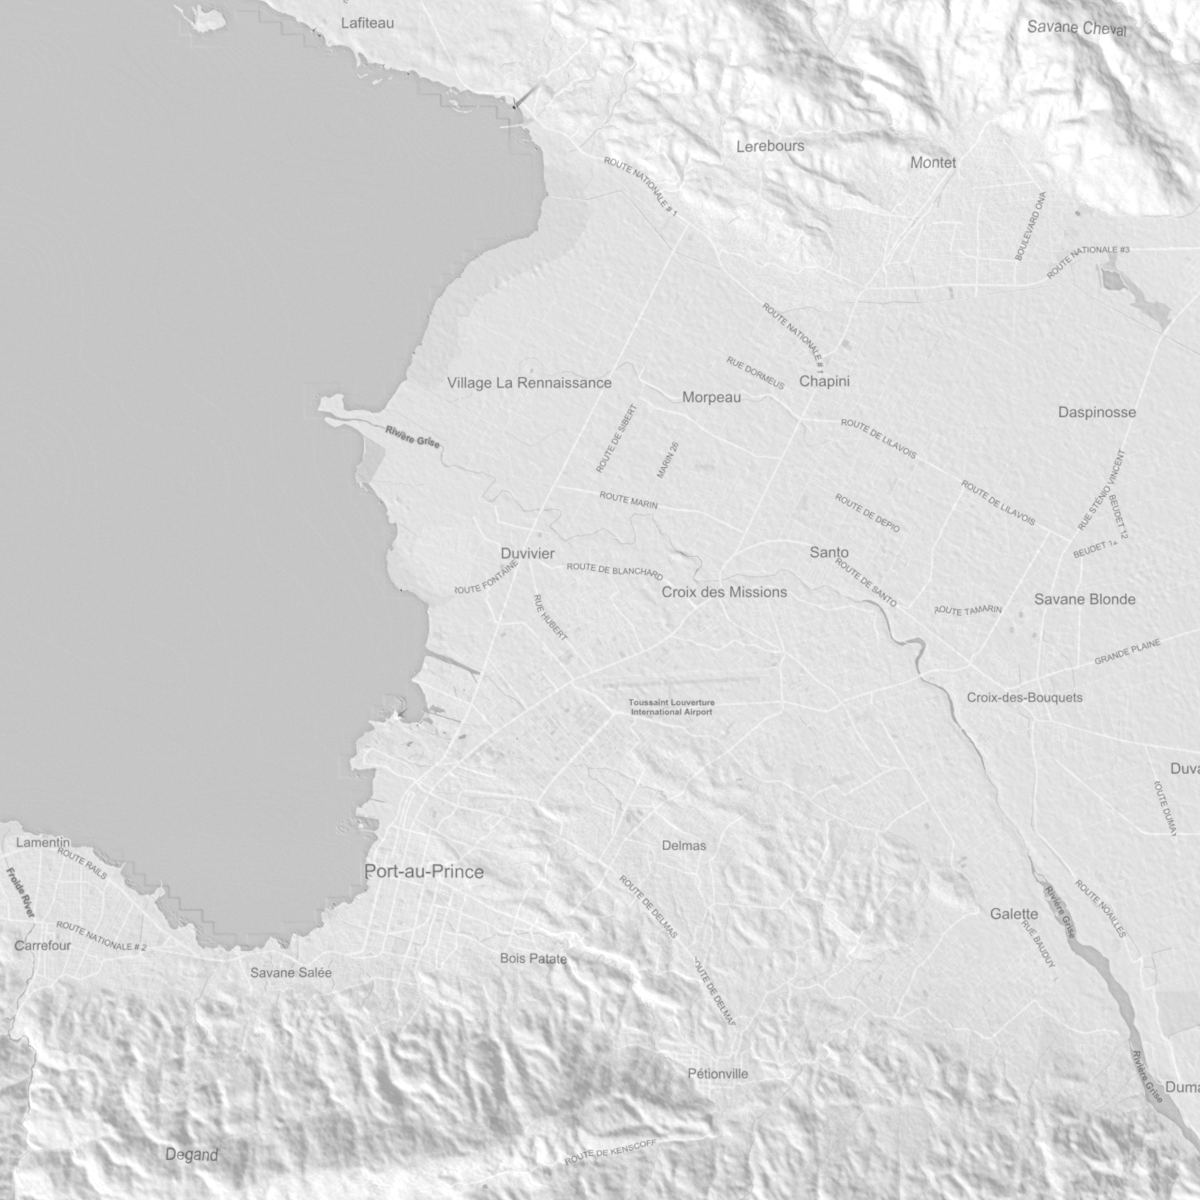
25*25 km, actual heights
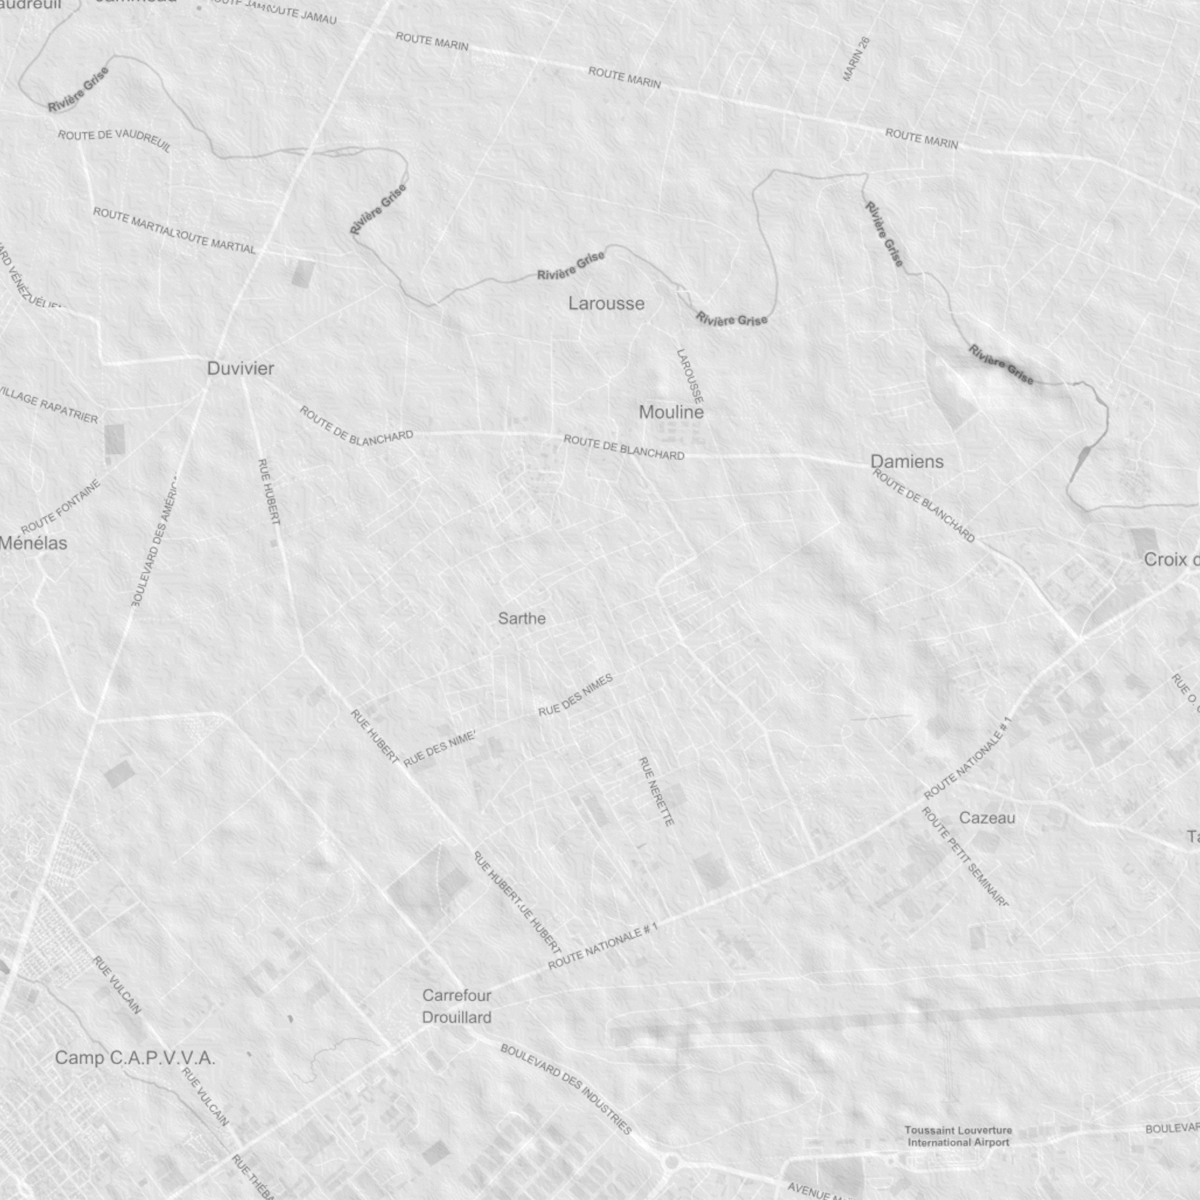
5*5 km, actual heights. This is about the maximum detail you can get out of the terrain heights.
Each map uses a displacement map of about 1300 pixels regardless of the size of the map in km. As long as you pick an appropriate zoomlevel, loading a new displacement map shouldn’t take much time.
The following attributions are for the above images
©Mapbox ©OpenStreetMap https://www.mapbox.com/about/maps/, Improve this map https://www.mapbox.com/map-feedback/
Mapzen terrain tiles contain 3DEP, SRTM, and GMTED2010 content courtesy of the U.S. Geological Survey and ETOPO1 content courtesy of U.S. National Oceanic and Atmospheric Administration. The fine print: https://mapzen.com/documentation/terrain-tiles/attribution/#the-fine-print
Source data
Both Mapbox and Mapzen use publicly available data in their terrain heights. Mapzen also includes bathymetry (stuff underneath the sea surface). In the examples it’s visible that the resolution of the bathymetry is different than the detail on land. For instance the image of the 400*400 km area has sharp mountains on the island and dull elevation at sea.
Here’s info on what data Mapzen uses. And here’s what Mapbox uses. You need to scroll down a bit to the Mapbox terrain section.
Mesh density
The level of detail in the terrain not only depends on the size and resolution of the displacement map but also on the density of the mesh. The map object is basically a plane with a turbosmooth modifier applied. By default the turbosmooth iterations value is set to a level relative to the size of your map. If you have a big map, the mesh is subdivided less than when you have a small map. This avoids crashing max by using unrealistic turbosmooth values.
You can finetune the mesh density by using the `Terrain mesh density` slider. This sets the number of segments on the map plane. You can also manually go into the map object and alter the turbosmooth subdivisions.

Finetune the terrain mesh density
Here’s a series of renders of the same terrain with increasing detail (i.e. decreasing subdivision). Each render uses the same SRTM1 terrain and displacement map of about 4800*4800 pixels.
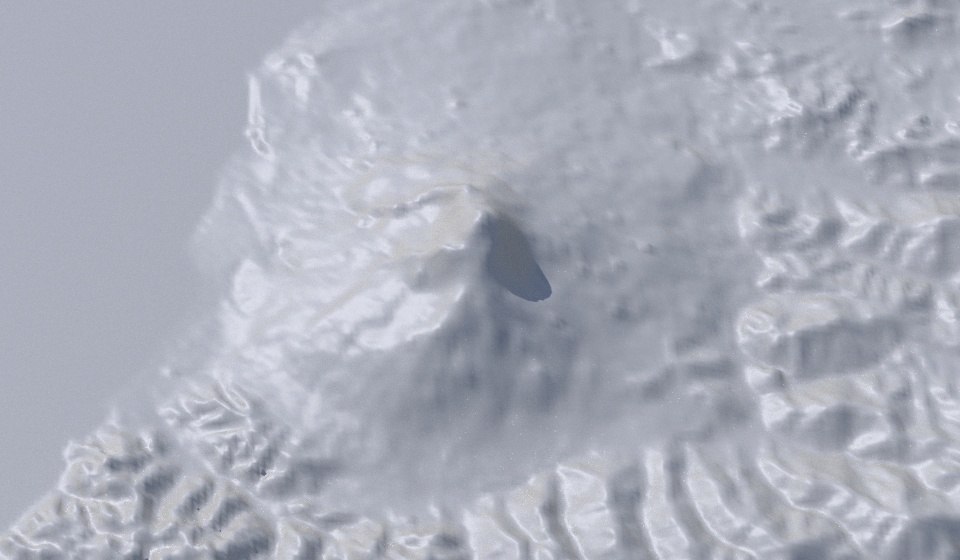
Terrain mesh density: 10
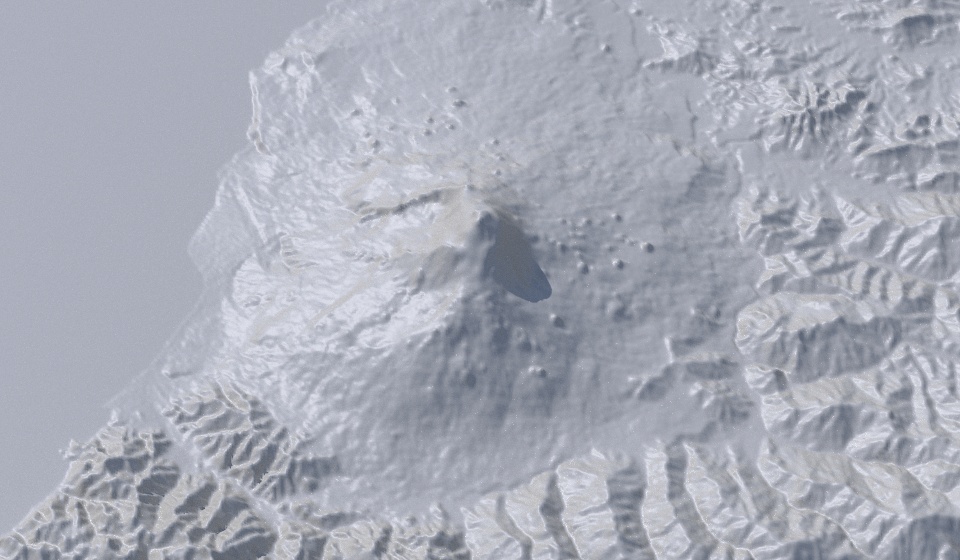
Terrain mesh density: 25
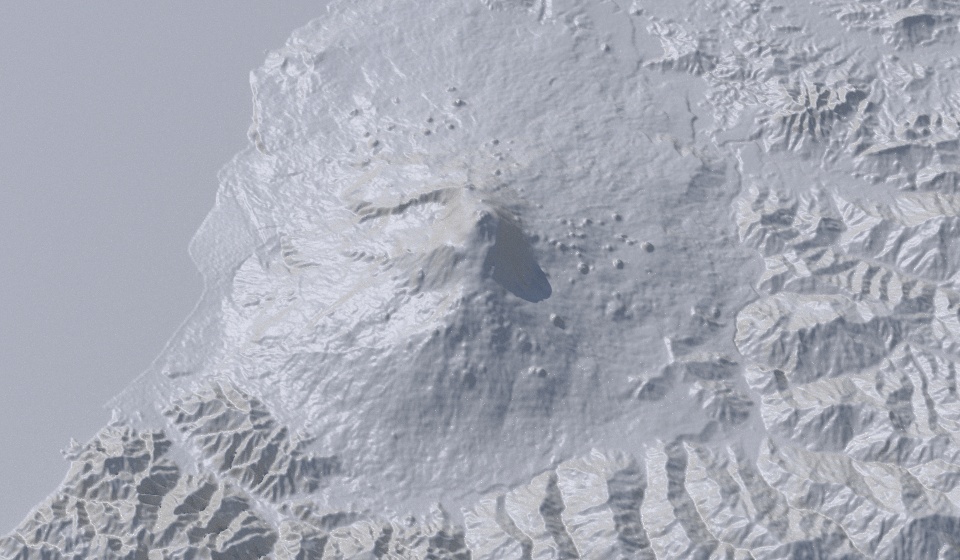
Terrain mesh density: 40